
Page 25 - Jesus College Strategic Plan 2017-21
P. 25
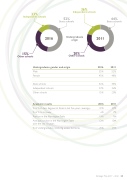
33% Independent schools
2016
15% Other schools
Undergraduate gender and origin
Male
Female
State schools
Independent schools
Other schools
Academic results
% of  rst class degrees at  nals in last  ve years (average)
% of 2:2s or lower
Position in the Norrington Table
Average position in the NorringtonTable over the last 10 years
% of undergraduates receiving access bursaries
State schools
36% Independent schools
52% 44%
State schools
Undergraduate 2011 origin
20% Other schools
2016 2011
55% 52%
45% 48%
52% 44%
33% 36%
15% 20%
2016 2011
32% 29%
6% 7%
13th 7th
12th 10th
25% 25%
Strategic Plan, 2017 – 2021 25
